Featured Article
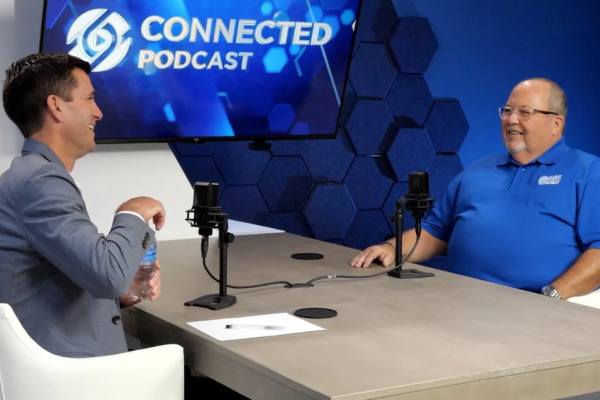
Is your sales team staying in tune?

Everybody enjoys a good musical performance. The singer producing an amazing melody on the microphone and the band backing them up with their instruments. The…

Configuring Posting Screens in ERA-IGNITE Accounting
If most of your day is spent posting to the journal, try starting in posting mode instead of starting in search mode.

Understanding the FTC’s Enforcement Tools and How You Can Create Your…
The Federal Trade Commission (FTC) has intensified its focus on dealerships and is attempting to add new regulatory practices to their already robust arsenal. If…
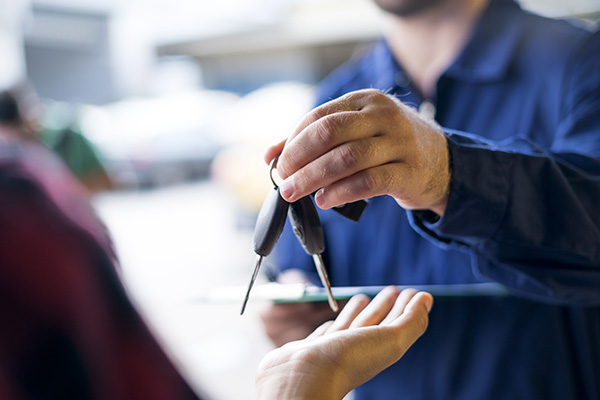
3 Tips to Build a Better Check-In
Service check-in is a foundational part of every service visit, but when is the last time you stopped to evaluate the process? Your service advisors…

10 Ways to Protect your Dealership from Synthetic Fraud
Dealerships are now at a higher risk of losing out due to fraud, and one misstep could lead to a substantial financial loss. Here are…

Beware and Prepare: What You Can Learn from the “Ides of…
For Julius Caesar, listening to a warning was a matter of life or death. When it comes to keeping your business healthy and profitable, staying…

Utilizing Tech to Acquire Highly Profitable Inventory
Over the last few years, you’ve probably grown accustomed to sourcing used vehicles from a variety of places, but acquiring a decent sized inventory is…
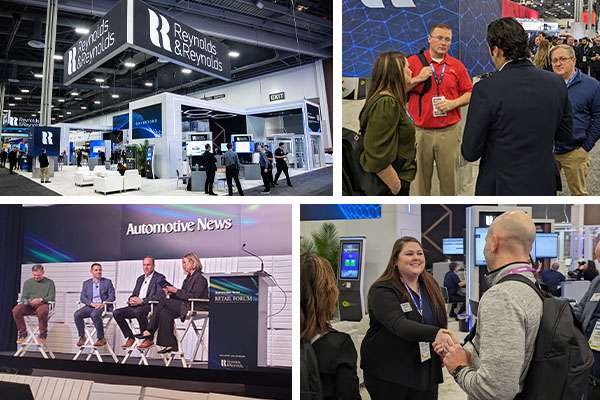
Amid the NADA Buzz, 3 Common Themes I heard from Dealers
NADA is always a busy, boisterous event – multiply it by 10 when you’re in Vegas. As I walked around the show talking with dealers,…
Tackling Technician Turnover
Retaining technicians in an industry riddled with turnover is never easy. So how do you do it?

Creating Consistency in Your Sales Experience: Connecting With Your OEM
Back in August, Nissan announced they were expanding their EV portfolio and making changes to their retail strategy. They want to align the OEM and…